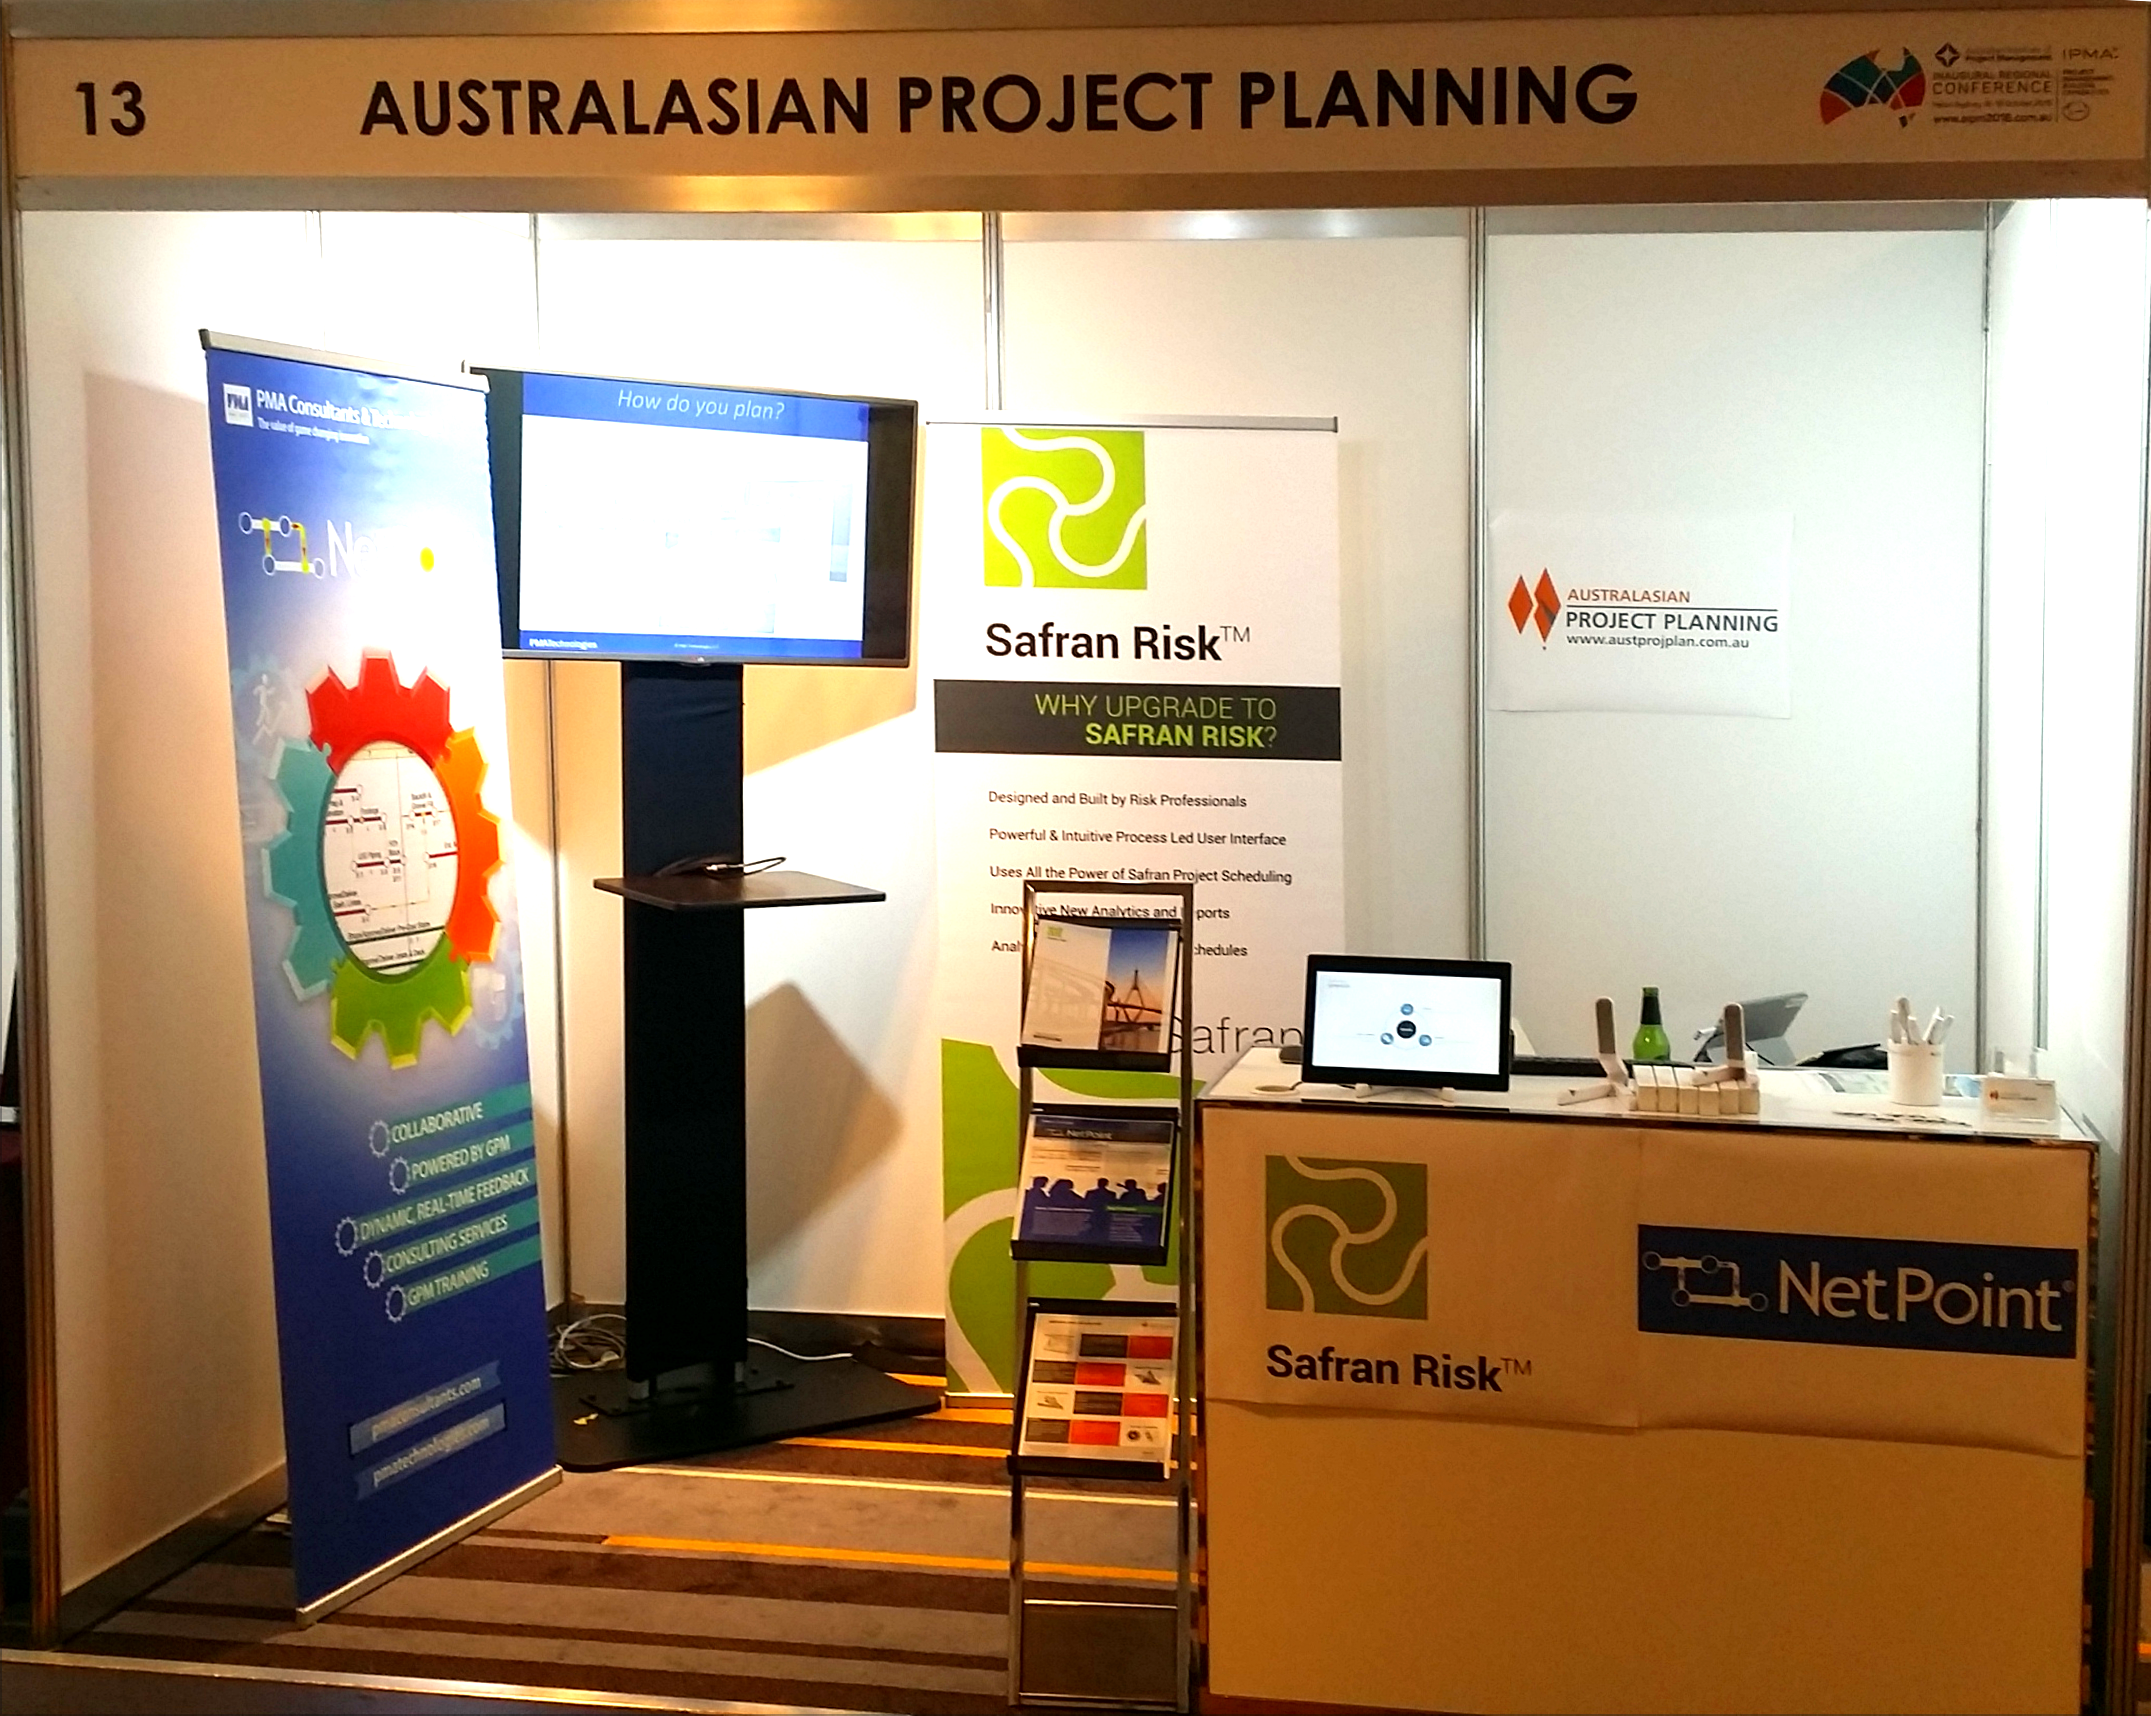
Australasian Project Planning exhibited at the AIPM Regional Conference, providing information on Safran Risk and Netpoint

Recent Articles

Correlation in Schedule Risk – Example

Introduction A key issue when undertaking Schedule Risk Analyses (SRA) is understanding correlation and its significance on results, this article aims to provide a simple example to illustrate correlation, and how SRA results are effected. Dr David Hulett, an expert...

Linear Schedules and Calendars

When presenting Linear Schedules, the rate of progress across the physical units is a key factor in representation, for example if a tunnel excavation is to be shown as progressing at 5m/day then you would expect that after ten days of work, the activity has...

6th Annual Netpoint and GPM Conference

Australasian Project Planning was represented at the 6th Annual Netpoint and GPM user conference in New Orleans, USA. Santosh Bhat presented on Time-Location Reporting and the features of Netpoint that enable effective reporting for Linear Projects. The published...

Merge Bias in Schedule Risk – example

Introduction Often when running schedule risk analyses, I get asked “why are the results always showing...

Chainlink Shape and Offset Reference Sheets

Chainlink Bar Shapes How to represent activities is a key decision when producing Time Chainage charts. Some activities suit being presented as lines progressing across the works, others are suited to being blocks indicating occupancy of an area. Chainlink offers...