When presenting Linear Schedules, the rate of progress across the physical units is a key factor in representation, for example if a tunnel excavation is to be shown as progressing at 5m/day then you would expect that after ten days of work, the activity has progressed 50m. But sometimes it hasn’t – why is this? Calendars, is the answer. The ten days may not represent ten work days, and ten work days may actually be 11 calendar days.
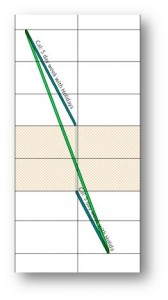
Consider the above diagram, both dark and light green bars are activities with the same start and end dates and location, however the darker green bar depicts the effect of work calendars, and the corresponding gradient of the activity – subtle but important.
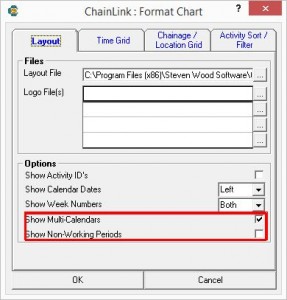
If you’re a Chainlink user, the above is quite easy to achieve. You will need to import calendars from a Primavera XER file to get the non-word periods populated, then when generating the chart, make sure the “display multi-calendars” option is ticked.