Introduction
A key issue when undertaking Schedule Risk Analyses (SRA) is understanding correlation and its significance on results, this article aims to provide a simple example to illustrate correlation, and how SRA results are effected. Dr David Hulett, an expert in the field of Schedule Risk Analysis states
“The degree of correlation between the activity durations has long been understood as being important for estimating correctly project schedule risk analysis”.
What is Correlation?
Correlation can be described as the relationship between two variables, in Schedule Risk correlation can exist between:
- The existence of risks, that is – if a risk occurs, then another related risk is likely to occur
- The impacts of risks, that is – the impact from one risk, is related to another impact.
Any relationship that exists between the risks and/or their impacts can be simulated by setting values of correlation during the Monte-Carlo sampling. Consider the diagrams below. Each marker represents a single iteration of the durations for two activities selected through 1000 iterations of the Analysis.
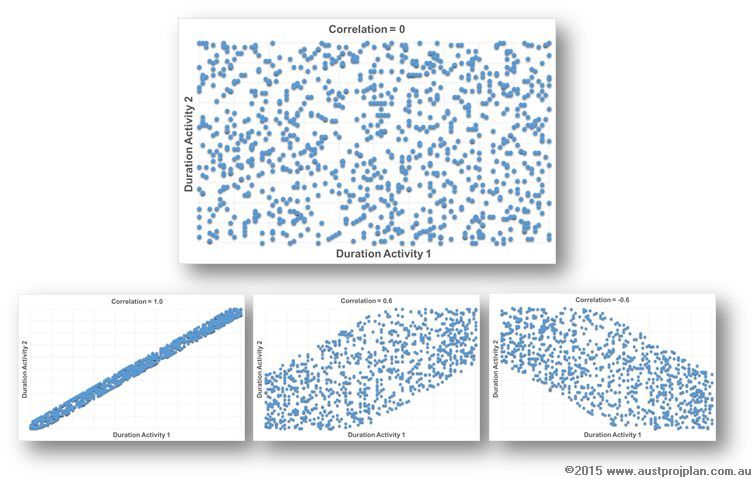
The top diagram shows the sampling for no correlation (ie Correlation = 0), the duration of one activity is independent of the other, and the result is a broad scatter of selected durations. The lower diagrams represent correlation values of 1.0, 0.6 and -0.6 respectively. Note that with correlation set to 1.0, the duration of one activity, is completely dependent on the other.
Example of Correlation in Schedule Risk Analysis
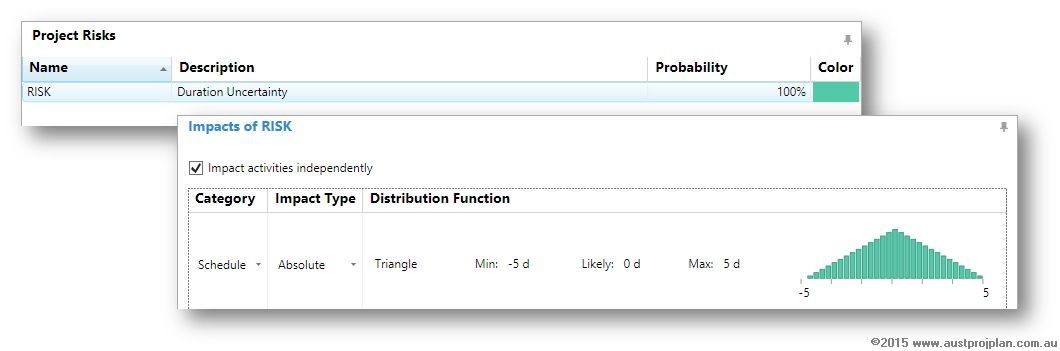
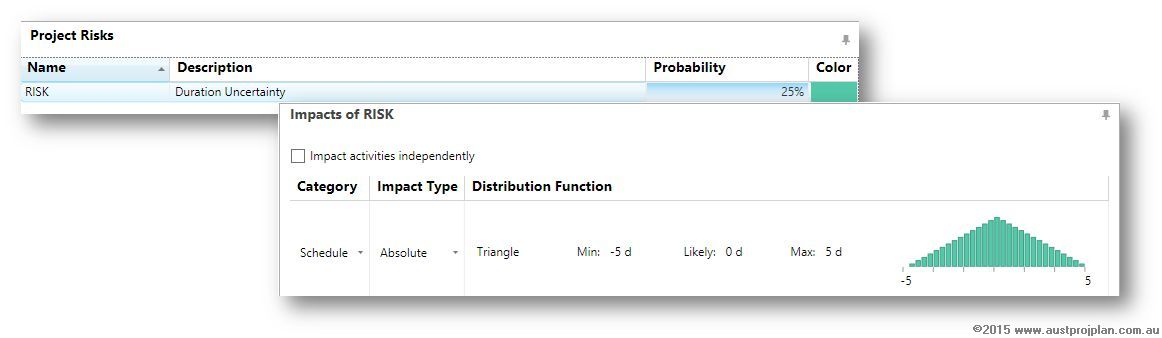
For the example presented, Safran Risk will be used to demonstrate the effect of correlation. Consider a simple schedule of four activities, each 20days in duration, for a total schedule duration of 80days. A risk is assigned to each activity, with impact values of Min. -5days, Likely 0days and Max. 5days as shown below. Therefore the duration uncertainty of each activity is 15/20/25days respectively). Note that each activity is marked to be impacted independently.
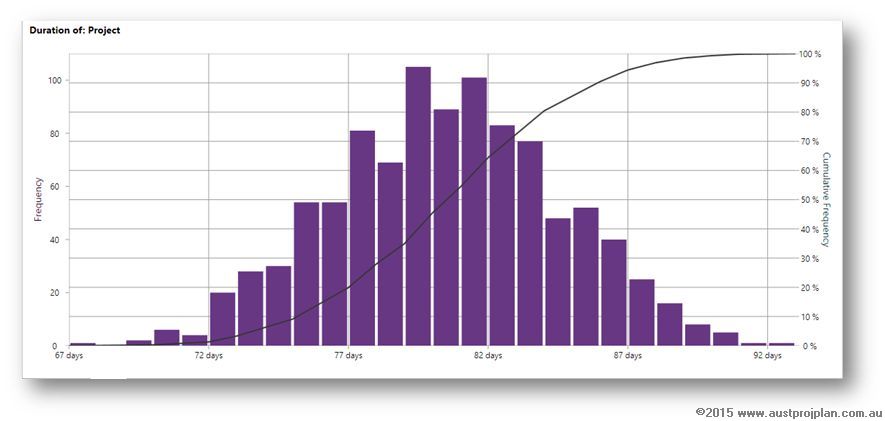
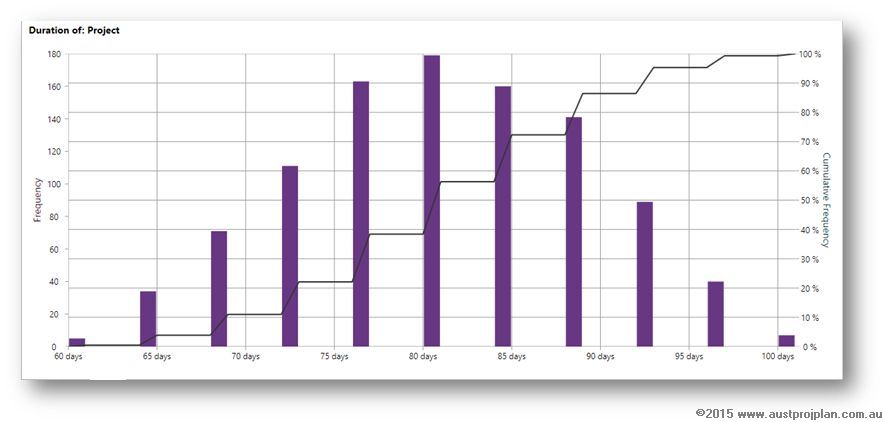
The result of this analysis is shown below:
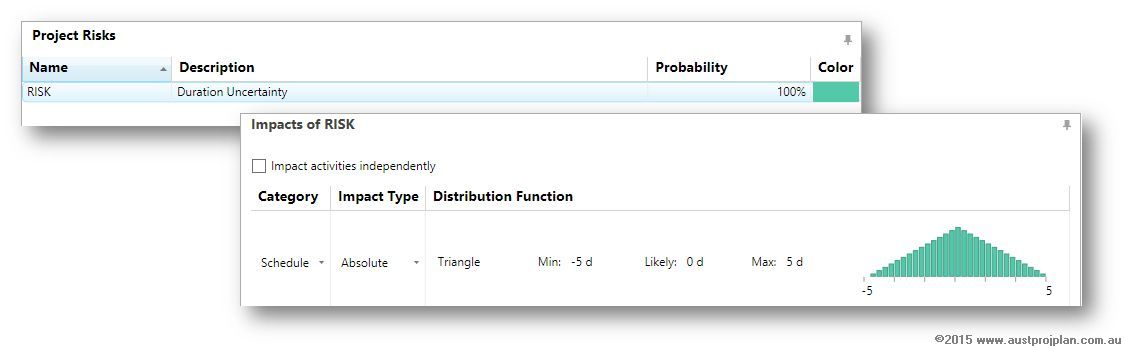
The same risk is applied, now with the impact on activities marked as not independent, this effectively sets correlation equal to 1.0, as shown below:
The result of this analyses is shown below:
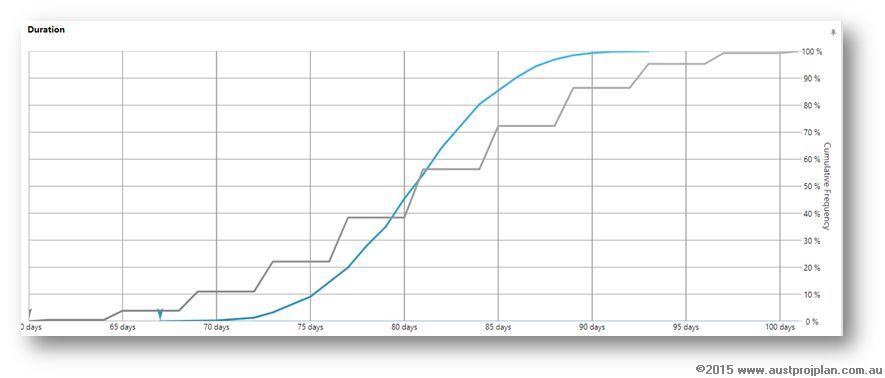
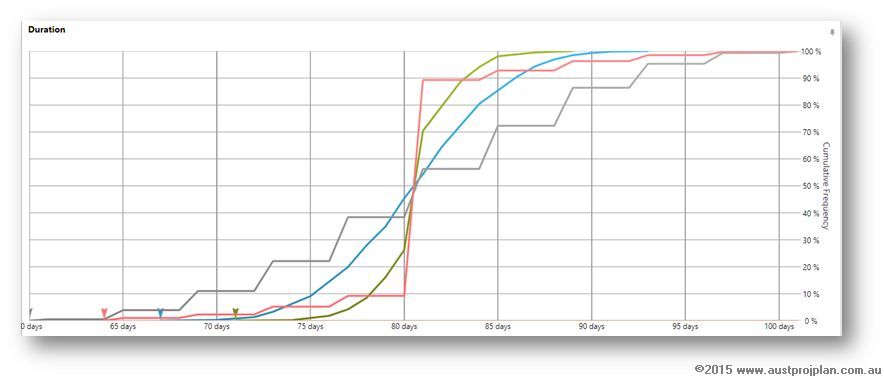
To compare the two results, Safran Risk’s Distribution Comparison provides an interesting output:
Explanation
With no correlation, (each activity being impacted independently) the sequence of activity durations may be 15,18,21,20 days respectively, or 18,16,21,24 and so on. The positives and negatives can cancel one another producing a range of results from a minimum schedule duration of 60days to a maximum of 100days and any value in between. This produces a smooth “S” shaped cumulative distribution profile.
With correlation, (each activity is dependent on one another) the selected value of one activity is the same for all activities – all activities in the sequence will be 16, or all will be 21 etc. The overall schedule duration will only be 60, 64, 68 etc, producing the stepped result of the cumulative distribution profile.
Comparison
When comparing the results, two interesting observations can be noted:
- At P20 levels of confidence, the correlated result shows a shorter project duration, and at P80 a longer project duration, that the equivalent confidence levels of the uncorrelated result.
- Due to a probability rule called the “Central Limit Theorem”, in this example, the P50 produces the same result regardless of correlation.
Discrete Risks
While the above example used duration uncertainty, a similar effect can be noted if correlation is applied to the impact of a discrete risk. Using a similar example, this time with the risk probability at 25% rather than 100%:
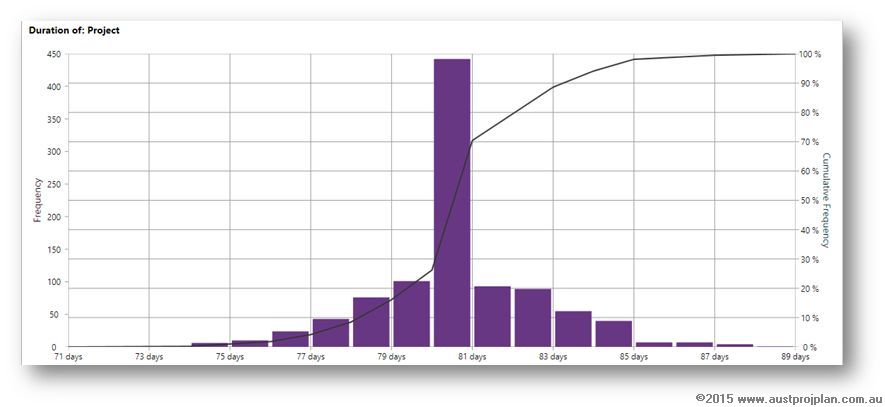
Produces the following result:
And comparing between results:
The same effect can be noted.
Hopefully the above article sheds some light on why correlation is an important consideration to be noted when performing Schedule Risk Analyses. Particularly considering the combined effects of correlation with Merge Bias or the use of Cascading sequences of schedule activities.