Occasionally when undertaking a Schedule Risk Analysis, the question gets asked “Can we create a risk adjusted schedule using the P80 dates from the analysis?”. The intent in such a question, is to produce a schedule using dates that are conservative and reflect the dates for an 80% likelihood of risks (that were analysed) occurring.
The short answer is “no”, P80 or any confidence level of dates are not derived from single durations, but reflect a range of results from many iterations. It is possible to present the resulting dates, but not as a logically linked network schedule. Consider the following examples to demonstrate this.
Example
The simple network shown below has three 14day duration activities. Uncertainty of 12/14/18 days (min, most likely, max respectively) is assigned to each of these activities. The results of the monte-carlo simulation are shown on the right for each activity. The P50, P80 and P90 durations are 14, 16 and 17 days. The dates for each of these results are shown by the larger green bars on the Gantt chart. Original/deterministic dates are the thinner lines.
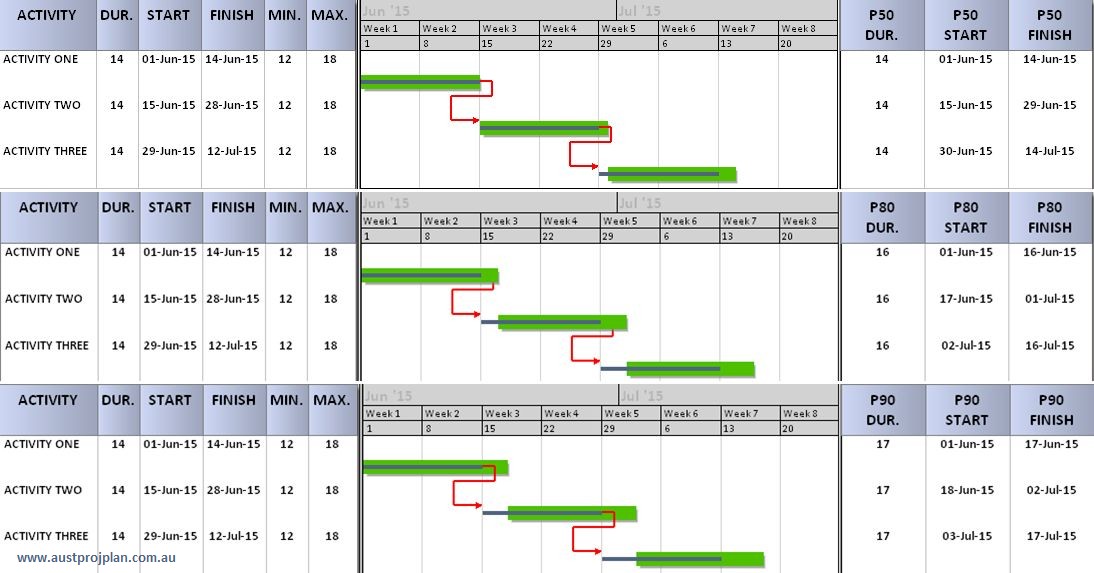
The flaw is due to the Pxx duration not aligning with Pxx dates as results are based on confidence levels over the range of results achieved. As activity logic must be satisfied, activities do not remain on the Pxx dates. Consider the same network as previous, this time setting the original/deterministic duration to the Pxx result, note that now, the deterministic dates do not align with the Pxx dates.
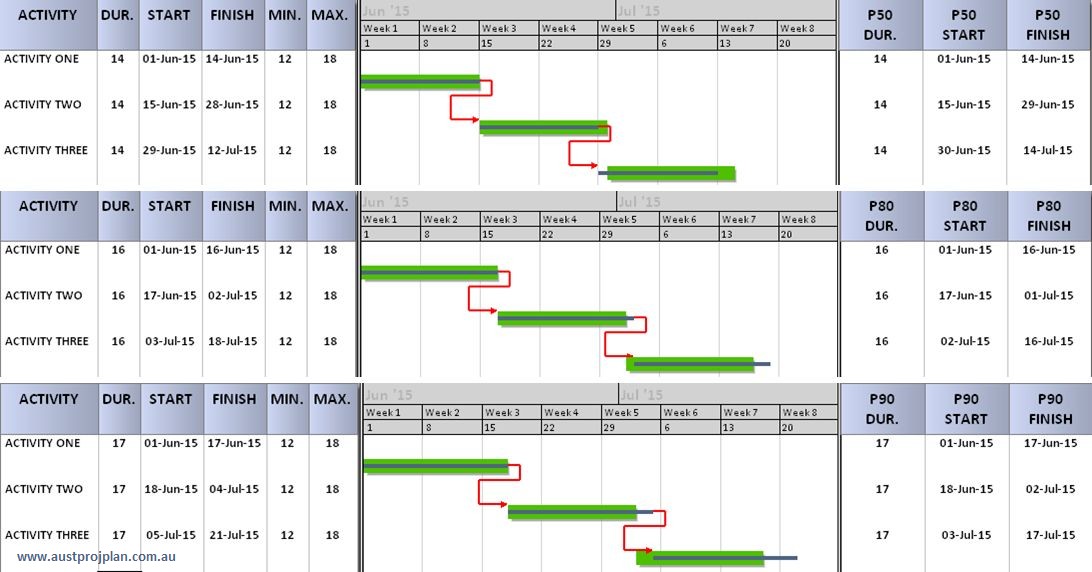
In the above scenario the P50 durations produce an earlier set of dates, while the P80 and P90 produce a later set of dates. The above example was very basic, consider the example below, where multiple activities link into a single activity. The same uncertainty values are applied to all activities as per the previous example.
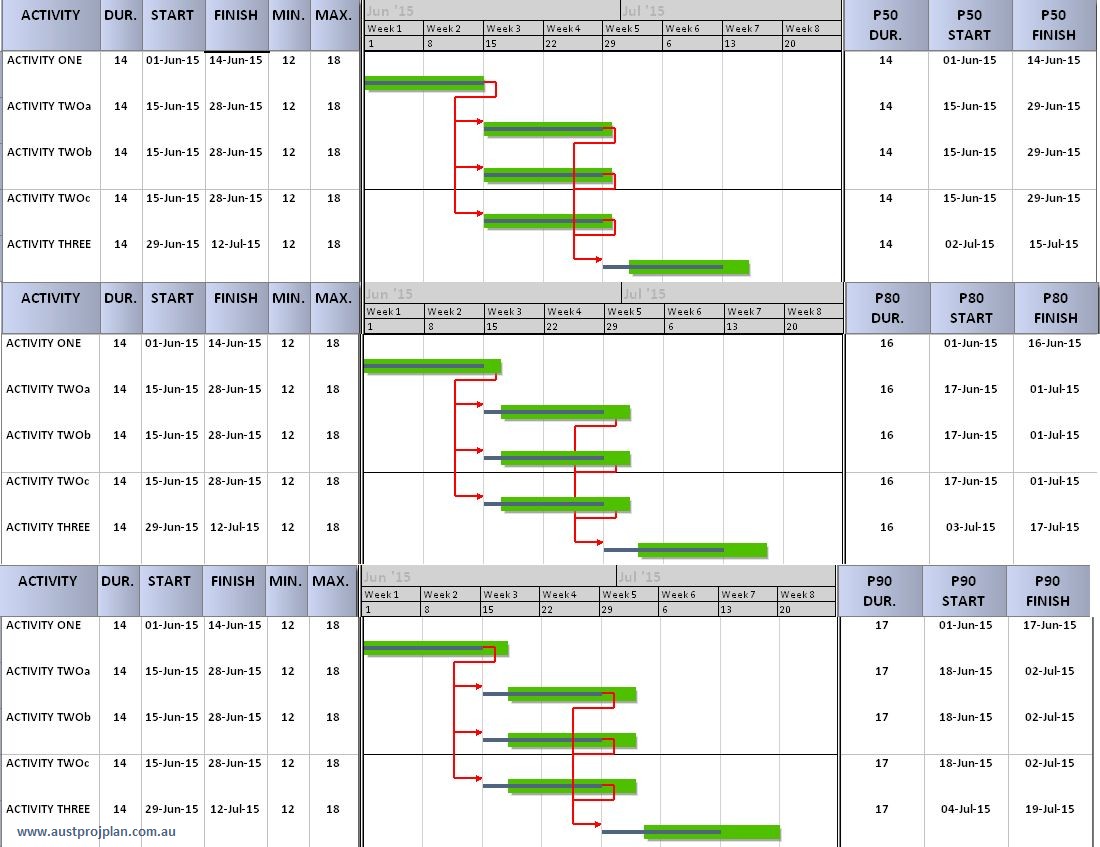
Merge bias compounds the flaw, particular at lower Pxx levels. Note the gap before Activity Three, in the larger Green bars, representing P50 dates
Solution
If pressed to produce an output that shows Pxx results, an option is to present the range of dates, but highlighting that it’s the deterministic logic and duations from which results are obtained. And, that risk adjusted values are exactly that – adjusted to include a range of results based on the analysis, but do not have logic between them. The example below is one option that can be considered, showing original dates and logic against 90% and 80% spread of dates.