Introduction
Often when running schedule risk analyses, I get asked “why are the results always showing a late project completion?” This usually gets asked when there is a proportionate (or equal) distribution of schedule opportunity as there are schedule threats.
The answer often is due to a phenomena known as Merge Bias, or Nodal Bias, and is a feature that has no equivalent in Cost Risk analysis. It is unique to schedules due to the logical relationships between activities. This article will provide a simple demonstration of Merge Bias and its impact that can assist in explaining why project completion may always return a later than expected result.
Example
Consider the following example of a single activity driving a completion milestone, the activity (and whole project) most likely duration is 100days, there is minimum duration of 80days, and a maximum of 120 days. Therefore an equal probability of the activity finishing earlier or later than the original deterministic duration. The results of the analyses using Netpoint™ and NetRisk™, are shown below.
Single Activity
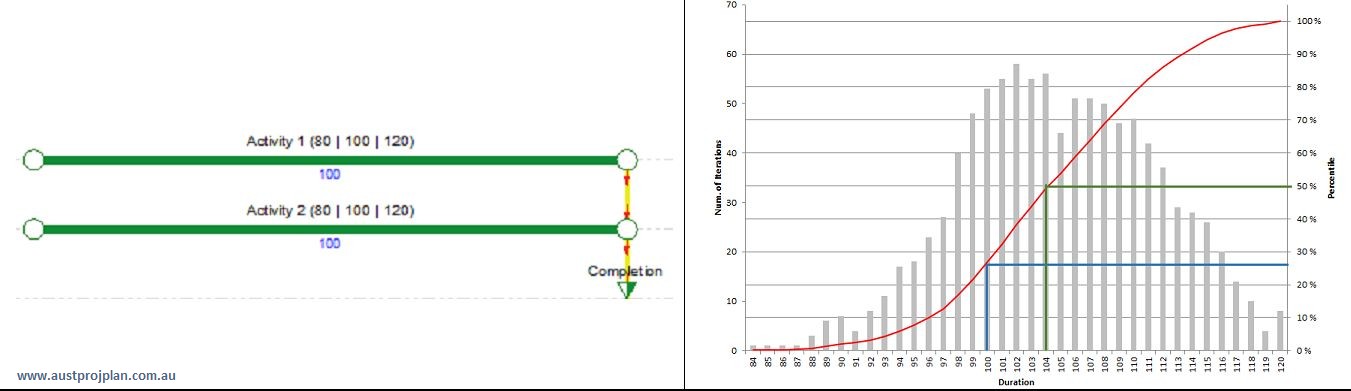
When only a single activity drives the completion milestone, the result is as expected based on the 80/100/120 range applied to Activity 1, the P50 result is 100days, and the original completion duration has a 50% chance of occurring:

Two Activities
When two activities drive the completion milestone, the P50 result is 104days, and the original completion duration has a 25% chance of occurring:
Four Activities
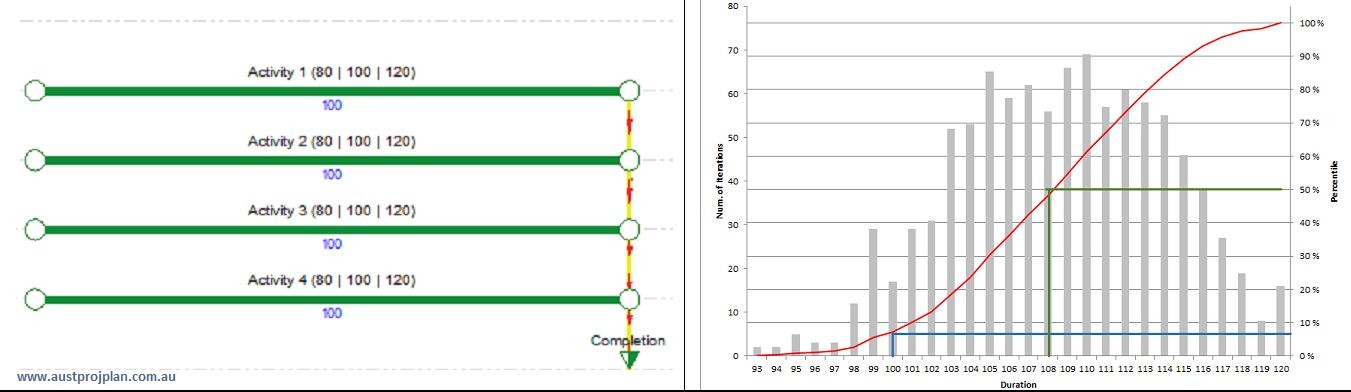
When four activities drive the completion milestone, the P50 result is 108days, and the original completion duration has an approximately 7% chance of occurring:
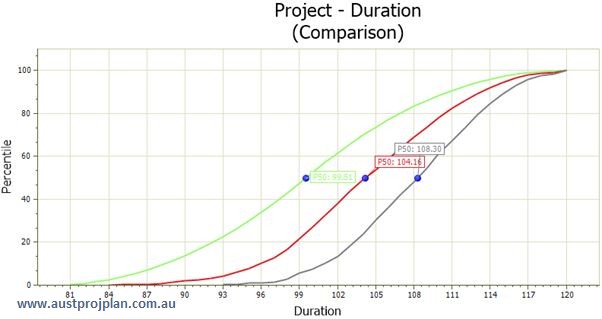
Comparison
Across the above results:
Explanation
Given that the completion milestone is driven by all four activities, the only situation where the completion is early, occurs, when ALL four activities are completed early. This only occurs 50% * 50% * 50% * 50%, i.e. in 6.25% of possible outcomes.
This is the merge bias effect, and the results for project completion are compounded by the number of merge bias points through a schedule that are effected by schedule risk.
Schedule Influence
Typically schedules are built with complex logical relationships between activities. The likelihood that there are merge bias points spread through a schedule are high. Consider the following examples of schedules reviewed: Activities with greater than or equal to 2 successors or predecessors are plotted against the schedule timeframe (the size of the circles is the proportion of driving relationships):
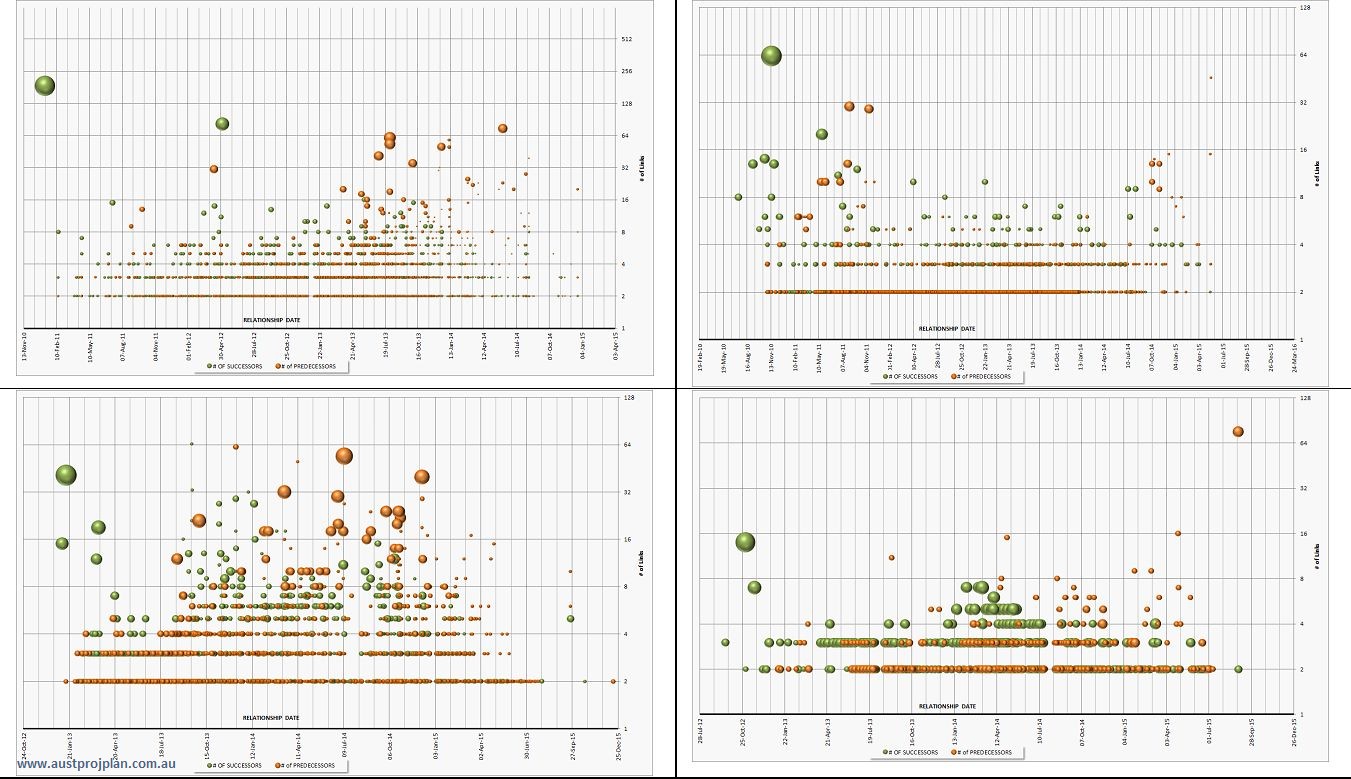
As can be seen from the above examples, merge points occur throughout schedules, and can be a significant influence in schedule risk analyses.