Context
Often, construction schedules are put together using overlapped activities, you may have seen them referred to as cascades, or waterfalls, or ladders, we’ll stick to Cascades for this article. Cascades are created by generating Start-to-Start(SS) and Finish-to-Finish(FF) relationships between activities, rather than using Finish-to-Start(FS) relationships. This is usually to reflect cases where one sequence of work can commence before the previous work has completely finished, for example, one trade may be able to commence works after the previous trade has completed sufficient work to create a “buffer”. This buffer is reflected by introducing a lag value onto the SS and FF relationships.
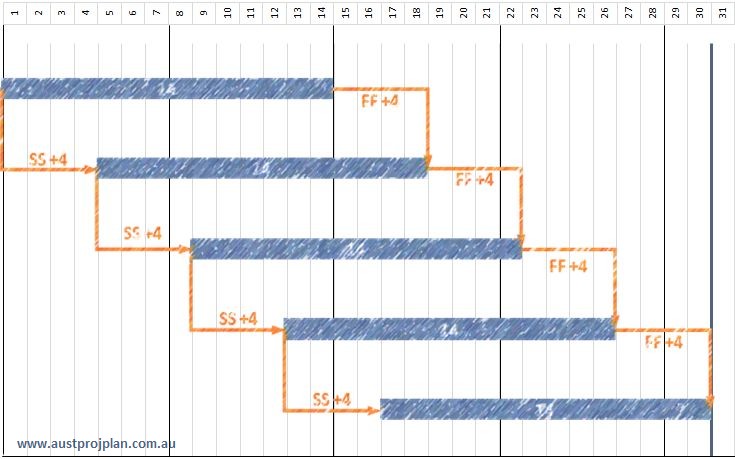
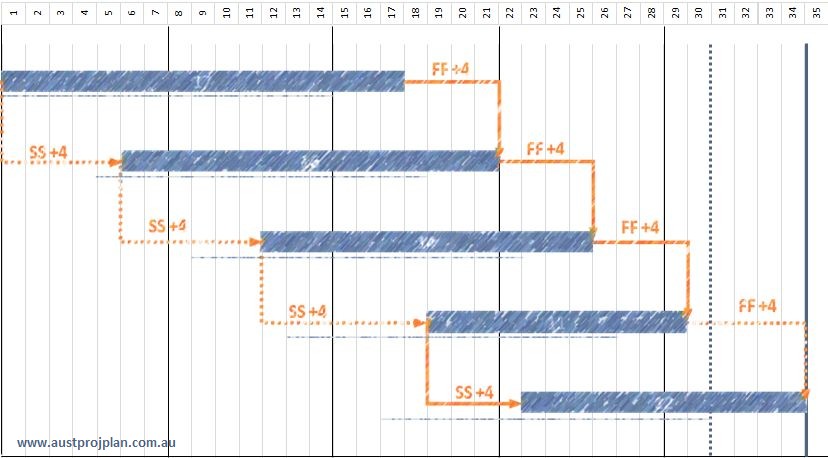
Consider the example below, a sequence of five activities, each of which is two weeks long, ie 14 days (for this article we’ll stick to using full week calendars to remove the influence of non-work days). They are in a Cascade of SS/FF to one another, using a four day lag between them, we’ll use the nomenclature SS/+4 and FF/+4. Starting on the first day of the month, this sequence of work finishes nicely on the last day of the 30 day month.
Adding Risk to the sequence
Lets consider that there is an element of risk against these activities, we’ll use duration uncertainty of these activities, but the same principles apply to any discrete risks that may also be applied to this sequence. To keep the example simple, lets say there is uncertainty of all five activities, where the minimum duration for any activity may be 11 days, and the maximum duration for any activity is 17 days. We’ll maintain the original duration of 14 days as the most likely case. ie the range is -3 | +3
This can also be interpreted as saying there is an equal chance of the any activity being completed earlier, or later than the original duration.
Results
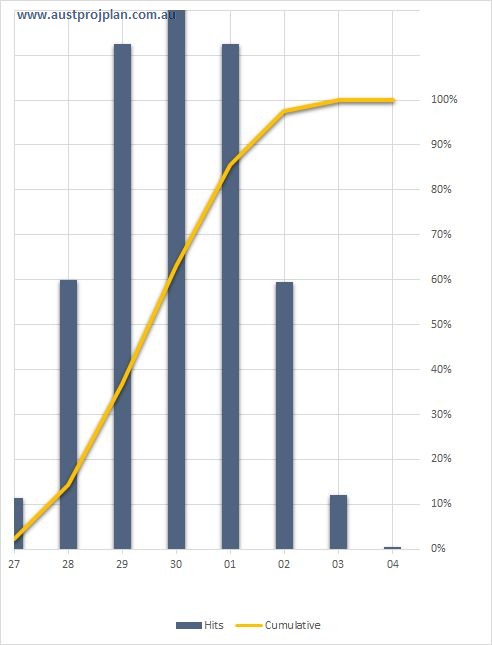
After running the Schedule Risk Analysis using the Monte Carlo method, based on the “equal chance” statement above, the results might be expected to indicate that the day 30 result has a P50 level of confidence, ie that 50% of results produced a date earlier than the 30th of the month, and 50% later. The results are shown below:
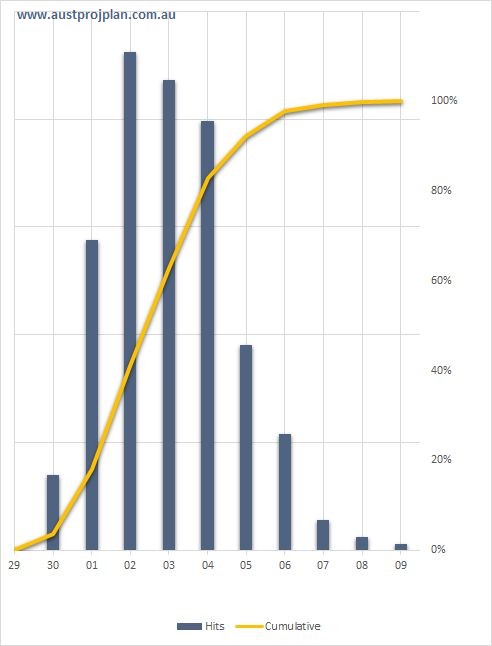
In contrast to the equal chance statement above, the original finish date of the 30th of the month, has only a 4% chance of occurring, and a P50 level of confidence equates to the 3rd of the following month, and P80 to the 4th.
So why does this occur? they are all the same duration, all with the same uncertainty, all with identical relationships? The answer is due to the nature of the Cascade, built using SS/FF relationships, in these situations, it is the relationships (and their inherent lag value) that influence the overall duration of the works, rather than the individual durations. The next section of this article will analyse this further.
Analysis
1st Iteration
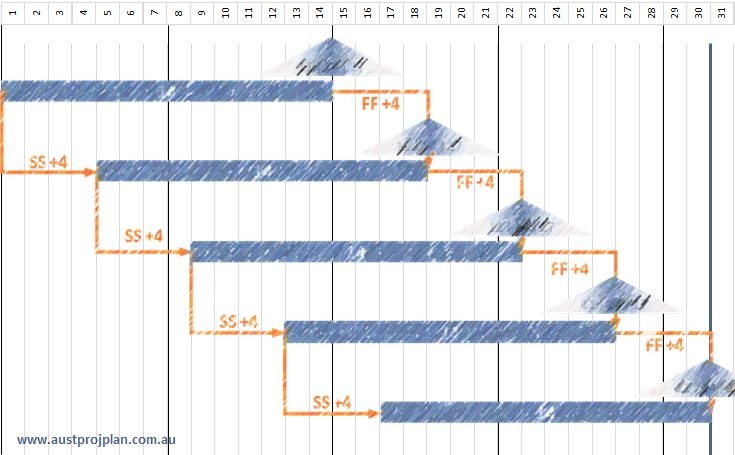
Lets consider one iteration that may occur during the Monte Carlo analysis, where the first two activities have a higher than original duration whilst the last two have a shorter than original duration, as shown below:
In this iteration, the shorter duration of the first two activities result in the SS/+4 relationship being the driving relationship of the entire sequence, the end result is three days later than original,
2nd Iteration
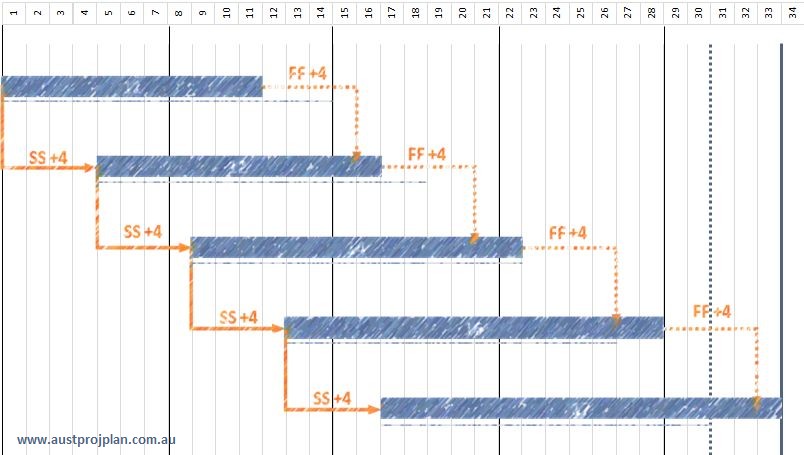
Lets consider an iteration where the opposite to the first occurs, the first two activities are longer, and the last two shorter:
In this iteration, the longer duration of the first two activities results in the FF/+4 relationship being the driving relationship, until a shorter duration activity, returns the driving relationship to SS/+4.
General
The above were two random iterations, of course the Monte Carlo simulation will randomise many other combinations, but a pattern emerges – that is, any gains made by a shorter duration, are always lost by longer durations due to the nature or the SS/FF relationship. If four out of the five activities had a duration less than 14 days, and one had a duration of 15 days, the overall sequence would still be one day longer than the original duration. Its a bit like Merge Bias, but also a bit not like it.
The dilemma
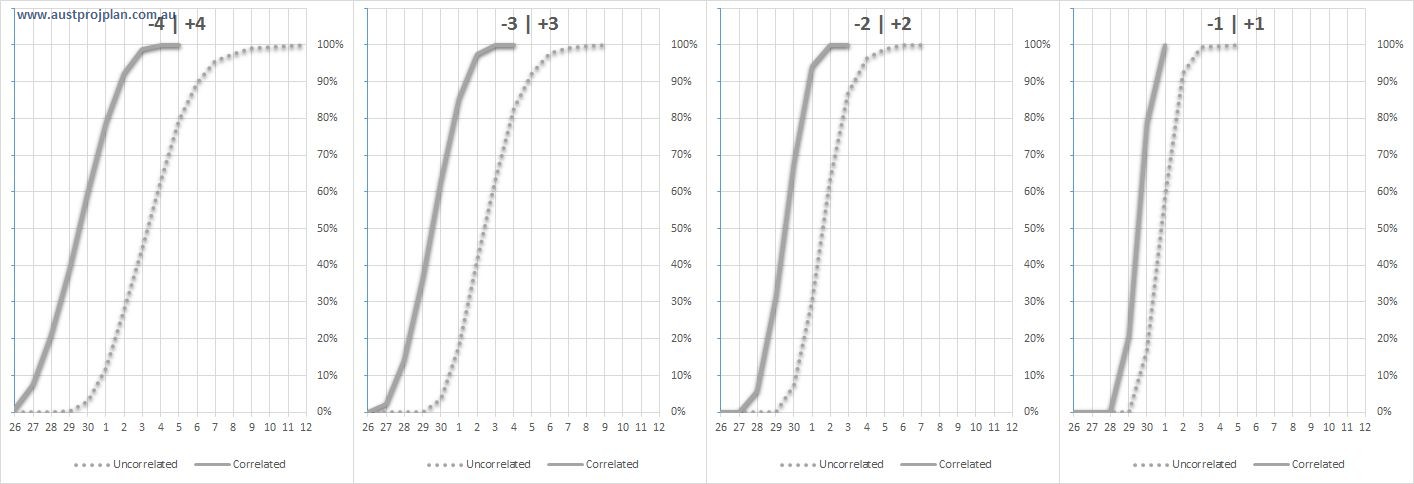
So this seems odd, each of the activities has an equal chance of being finished earlier, but overall duration of the whole sequence is rarely being completed earlier. What if we chose a different range of uncertainty say -4 | +4? The results below show the range of results if the range of uncertainty is varied, but kept to being an equal chance of earlier or later:
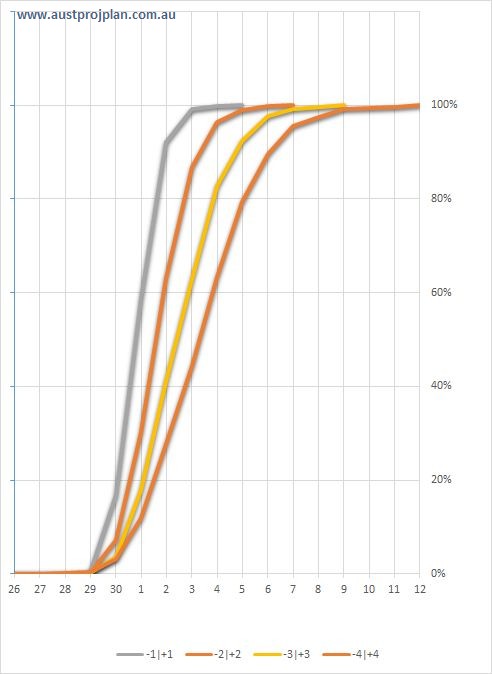
The results have a little impact on the chance of the original finish date being achieved, but still remains below 20%. So is this an accurate reflection of what might happen in practice? If the relationships in the schedule reflect reality, then the answer is unfortunately yes. There is a way to address this, and may be practical ,for example, where the Cascade represents the same trades moving across different areas.
Introducing Correlation
One way of dealing with the dilemma, is to change the Cascade sequence into a single activity, and place the -3 | +3 uncertainty onto that single activity. I don’t recommend this, as there would be a valid reason why the Cascade exists in the first place, perhaps there are other dependencies that need to be included in the sequence of work, and these would not be reflected in the single activity.
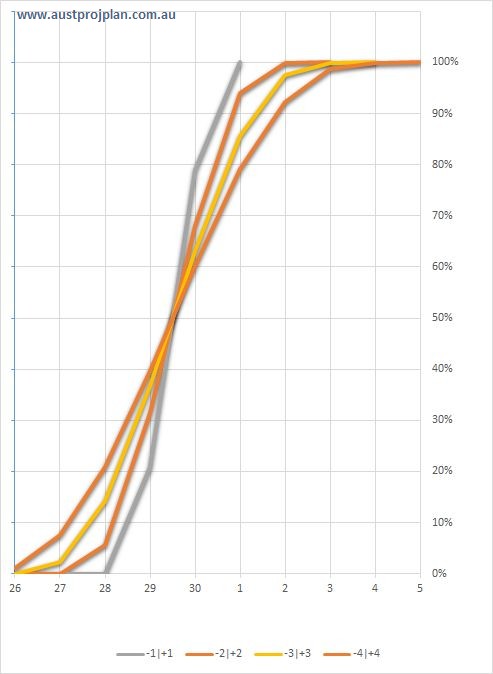
The other way is to Correlate the risks, such that all the activities in the Cascade are correlated to one another, ie if one random iteration selects a shorter duration, then the remaining activities will also have a shorter duration. The results when the degree of correlation is 100% are shown below:
These results show that there is an equal chance of the finish date being earlier or later, and in addition, different ranges of uncertainty have no influence on this P50 value as shown below:
Correlation has the effect of shifting results, as shown below, comparing the results for the varying duration ranges:
The wider the range, the larger the shift that correlation creates. Does the degree of correlation matter? Yes, at 100% all activities will be related, at lower values, the randomness between activity durations increases. Shown below are the results when keeping the duration range constant, but shifting the degree of correlation:
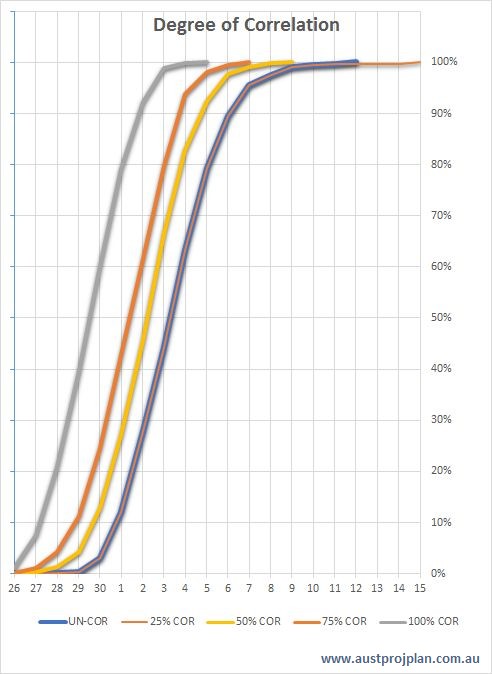
As randomness between the duration ranges increases (ie, no correlation), the finish date will increasingly be held out by the longest duration within the Cascade.
Conclusion
This article presented a particular case where a Cascade of activities linked by SS/FF relationships may not have the desired result when duration uncertainty (or discrete risks) are applied. Where the desired approach is to reflect the duration uncertainty over the full sequence, correlation between the activities needs to be considered.